2025年6月14日小作文
写作类型:TASK1 出题年份:2025 话题分类:线图
The graph below shows the average spending of four European governments on health per person(in Euros) from 2006 to 2013.
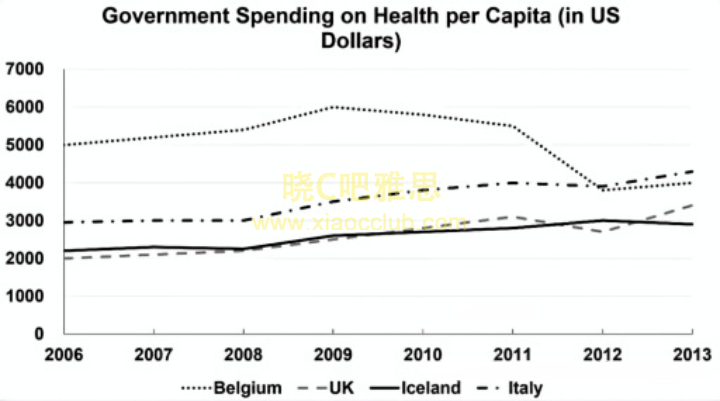
The graph below shows the average spending of four European governments on health per person(in Euros) from 2006 to 2013.

