2025年8月30日小作文
写作类型:TASK1 出题年份:2025 话题分类:线图
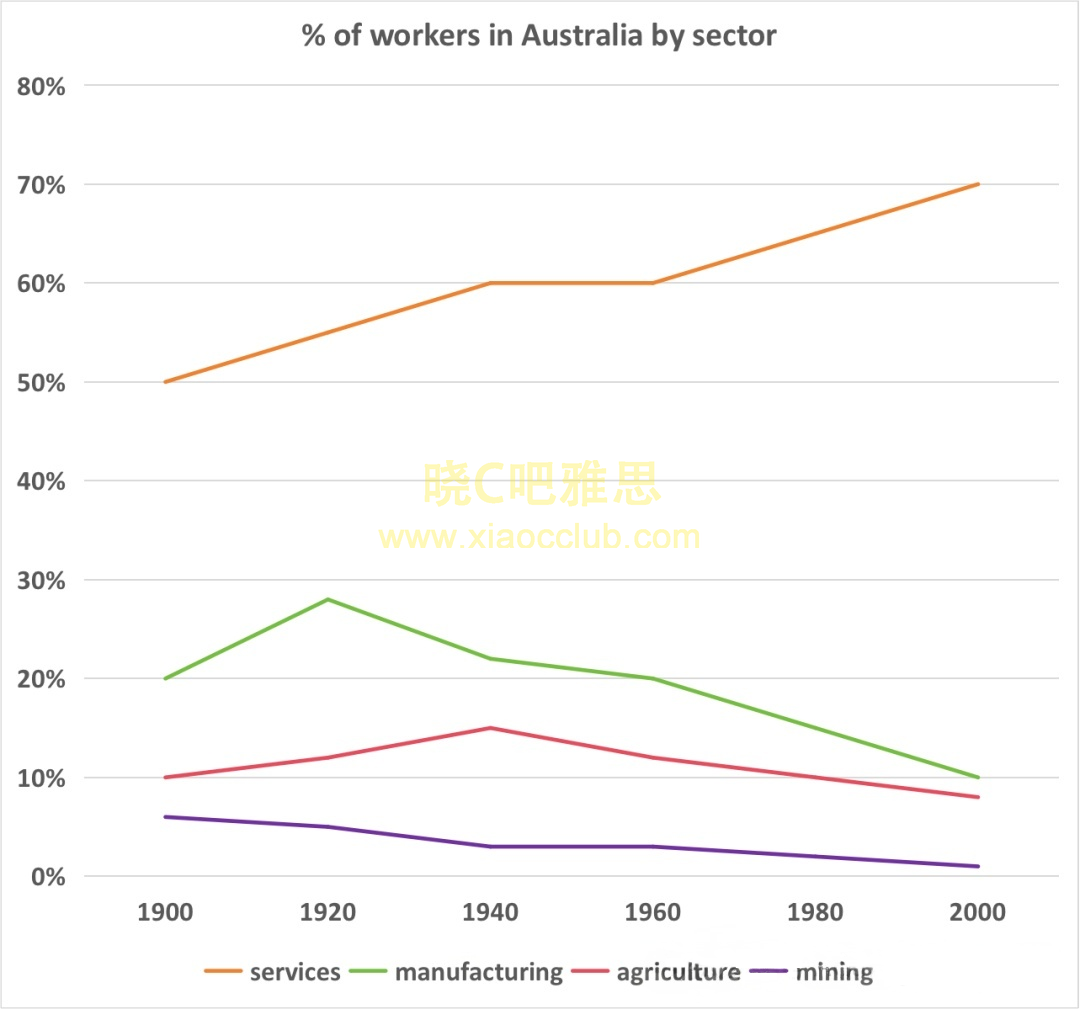
The graph below shows the proportion of worker employed by four different sectors in Australia from 1990 to 2000.
没有了
The graph below shows the proportion of worker employed by four different sectors in Australia from 1990 to 2000.
没有了

